
Call us:
+442036084550
Monday-Sunday (24 Hours)

 2026-06-09
James Smith
Have you ever faced a problem that keeps happening no matter how many times you try to fix it? Whether it is delayed projects, poor product quality, customer complaints, or process inefficiencies, solving only the visible issue often leads to the same problem returning again. A Fishbone Diagram helps businesses identify the root causes of problems instead of only treating the symptoms.
Understanding What is a Fishbone Diagram is important for improving problem-solving and decision-making. It helps teams organise possible causes of a problem in a clear visual format, making root cause analysis easier and more effective. In this blog, you will learn about its types, benefits, creation steps, and how it helps organisations solve problems more efficiently.
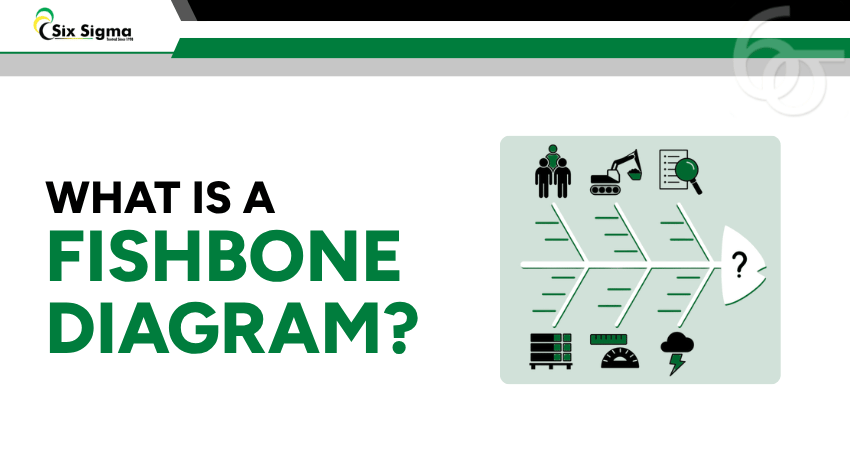
A Fishbone Diagram, also called an Ishikawa or Cause-and-Effect Diagram, is a visualising tool used to discover the root causes of a specific problem. Developed by Kaoru Ishikawa in the 1960s, its structure resembles a fish skeleton, with a central spine, a "head" representing the problem, and branching bones representing potential causes.

It is widely used in manufacturing, healthcare, and business to systematically explore all possible causes before jumping to solutions. By organising causes into major categories like People, Process, and Equipment, it helps teams think broadly and ensures no potential cause is overlooked.

The Fishbone Diagram is highly effective in the following situations:
1) Solving Specific Issues: It helps teams focus on identifying the actual causes of a problem instead of only dealing with visible symptoms. This supports more accurate and lasting solutions.
2) Improving Team Discussions: The diagram encourages team participation by allowing members to share ideas and insights during brainstorming sessions. This improves collaboration and problem-solving.
3) Understanding Complex Problems: When a problem is influenced by several factors, the Fishbone Diagram helps organise possible causes in a structured and easy-to-understand format.
4) Enhancing Processes: Organisations use the diagram to identify process gaps and operational weaknesses. This helps improve efficiency and reduces the chances of similar problems occurring again.
A Fishbone Diagram includes several key components that help teams organise and analyse possible causes of a problem systematically. The following components play an important role in effective root cause analysis. These elements work together to provide a clear and structured view of potential issues.
The problem statement represents the issue being analysed and is placed at the head of the Fishbone Diagram. It should clearly define the problem to keep the analysis focused and help teams identify the actual root cause more effectively.
Cause categories are the main branches connected to the spine of the Fishbone Diagram. They group similar causes together, such as people, process, materials, or equipment, making problem analysis more organised, structured, and easier for teams to understand. These categories help teams break down complex problems into manageable sections for better analysis.
Contributing factors are the smaller branches connected to each cause category in the diagram. They represent specific reasons that may be contributing to the problem and help teams analyse issues deeply to identify root causes more accurately.
Strengthen leadership and process improvement capabilities through the Lean Six Sigma Black Belt Upgrade Training – Register now!
Different types of Fishbone Diagrams are used based on the problem or industry being analysed. The following are the most commonly used types of Fishbone Diagrams:

The Simple Fishbone Diagram is the most basic and flexible type of Fishbone Diagram. It allows teams to create custom categories based on specific problems or industries. For example, organisations may use categories such as product-related issues, service-related issues, equipment, or customer concerns, depending on the situation. This flexibility makes it suitable for a wide range of problem-solving scenarios.
The 4S Fishbone Diagram is mainly used in service industries to identify the causes of operational or customer-related problems. It organises causes into four categories: Surroundings, Systems, Skills, and Suppliers. This structure helps businesses analyse service quality and improve customer satisfaction. It is particularly useful for identifying service-related inefficiencies and improving customer experience.
The 8P Fishbone Diagram is widely used in business and marketing environments. It includes eight categories: Procedures, Policies, Place, Products, People, Processes, Price, and Promotion. This model helps organisations analyse business operations, customer experience, and marketing-related issues more effectively. This comprehensive structure supports deeper analysis of business and marketing challenges.
The 6M Fishbone Diagram is commonly used in manufacturing and quality management. It categorises causes into Man/Manpower, Method, Machine, Material, Measurement, and Mother Nature. This structure helps manufacturers identify production issues, quality defects, and process inefficiencies systematically.
Creating a Fishbone Diagram involves a structured process to identify and analyse the possible causes of a problem systematically. The following steps explain how to create a Fishbone Diagram effectively:

1) Identify and Define the Problem: Begin by clearly defining the problem and placing it at the “head” of the Fishbone Diagram. The issue should be specific and clearly explained to avoid confusion during analysis.
2) Draw the Spine and Main Branches: Draw a horizontal line representing the spine of the fish and connecting branches to it. These branches will later represent the major categories of possible causes.
3) Identify Major Cause Categories: Determine the main categories that may contribute to the problem, such as people, process, equipment, or materials. These categories become the primary branches of the diagram.
4) Brainstorm Possible Causes: Within each category, list all possible causes related to the problem. Teams should ask questions like “Why does this happen?” to identify contributing factors systematically.
5) Analyse Deeper Causes: Continue exploring causes by repeatedly asking “Why?” to uncover deeper root causes. This helps teams move beyond surface-level issues and identify the actual source of the problem.
6) Review and Analyse the Diagram: After completing the diagram, review all the listed causes carefully. Analyse the information to identify the most likely root causes and determine suitable solutions.
Gain beginner-friendly Lean Six Sigma skills for workplace process improvement with the Lean Six Sigma Yellow Belt Training – Sign up now!
Creating an effective Fishbone Diagram requires clear analysis and structured brainstorming. The following tips can help improve the accuracy and effectiveness of the problem-solving process:
1) Focus on Root Causes: Avoid concentrating only on visible symptoms when creating a Fishbone Diagram. The main goal is to find out the underlying causes of the problem for more effective solutions.
2) Use Clear Visuals: Creating the diagram on a large board or visual workspace makes the process more organised, interactive, and easier for teams to understand during discussions.
3) Encourage Team Participation: Involve all team members in the brainstorming process to gather different ideas, experiences, and perspectives. This improves the quality of analysis and problem-solving.
4) Apply the “Five Whys” Technique: Repeatedly asking “Why?” helps teams explore deeper causes behind a problem. This technique supports better root cause identification when used alongside the Fishbone Diagram.
5) Keep the Diagram Focused: Address only one specific problem per diagram. Analysing multiple issues simultaneously makes it cluttered and reduces its effectiveness.
6) Validate with Data: Support identified causes with real data like measurements, records, or observations rather than relying solely on assumptions, ensuring more reliable corrective actions.
A Fishbone Diagram helps teams identify possible causes of a problem systematically. Understanding its advantages and disadvantages helps organisations use the tool more effectively for problem-solving:
1) Root Cause Identification: A Fishbone Diagram helps teams move beyond surface-level symptoms and identify the actual root causes of a problem more effectively.
2) Clear Visual Structure: It presents cause-and-effect relationships in a simple and organised visual format, making complex problems easier to understand and analyse.
3) Improves Team Collaboration: The diagram encourages brainstorming and allows team members from different departments to share ideas and perspectives during problem-solving.
4) Flexible and Versatile: Fishbone Diagrams can be adapted for different industries and processes using various frameworks such as the 4S, 4P, or 6M models.
5) Supports Better Decision-making: By organising possible causes clearly, the diagram helps organisations make informed decisions and improve processes more effectively.
1) May Oversimplify Complex Problems: Fishbone Diagrams may not fully explain highly complex problems where multiple causes and effects are deeply connected.
2) No Quantitative Analysis: The diagram identifies possible causes but does not measure their impact, frequency, or level of importance statistically.
3) Can Become Cluttered: When too many causes are included, the diagram may become crowded, confusing, and difficult to analyse properly.
4) Depends on Team Knowledge: The effectiveness of the diagram relies heavily on the experience, knowledge, and participation of the team involved in the analysis.
5) Does Not Directly Provide Solutions: While the diagram helps identify possible causes, additional analysis and planning are still needed to develop effective solutions.
Learn data-driven techniques to improve quality and business efficiency through the Lean Six Sigma Green Belt Training – Register now!
Here is an example of how a Fishbone Diagram can be used to identify the causes of delayed customer deliveries in a company:

Problem Statement: Why are customer deliveries getting delayed?
People:
a) Insufficient staff availability
b) Lack of employee training
c) Poor communication between departments
Process:
a) Inefficient order management system
b) Delayed approval procedures
c) Poor workflow coordination
Equipment:
a) Vehicle maintenance issues
b) Outdated tracking systems
c) Frequent technical failures
Materials:
a) Delayed supplier shipments
b) Shortage of packaging materials
c) Incorrect inventory management
Environment:
a) Traffic congestion
b) Bad weather conditions
c) Poor warehouse layout
Management:
a) Inadequate planning
b) Weak scheduling practices
c) Lack of performance monitoring
By analysing these possible causes through a Fishbone Diagram, the company can identify the main reasons behind delivery delays and implement suitable improvements to increase operational efficiency and customer satisfaction.
By understanding What is a Fishbone Diagram, organisations can uncover hidden causes behind problems and make smarter decisions with confidence. Its structured and visual approach improves teamwork, strengthens problem-solving, and helps businesses create effective long-term solutions that enhance productivity, quality, and overall operational performance.
Build process improvement skills for measurable business and operational success through the Lean Six Sigma Training – Join now!


Thank You For Your Enquiry.
Our representative will get in touch with you shortly. You can also:Call Us: +442036084550
Email Us: info@sixsigma.co.uk